Build a Personal Cryptocurrencies Portfolio with Spreadsheets and JavaScript
Fetch live crypto prices, value your holdings and see each coin's share of the portfolio — written in JavaScript inside spreadsheet cells with Fluidtable.

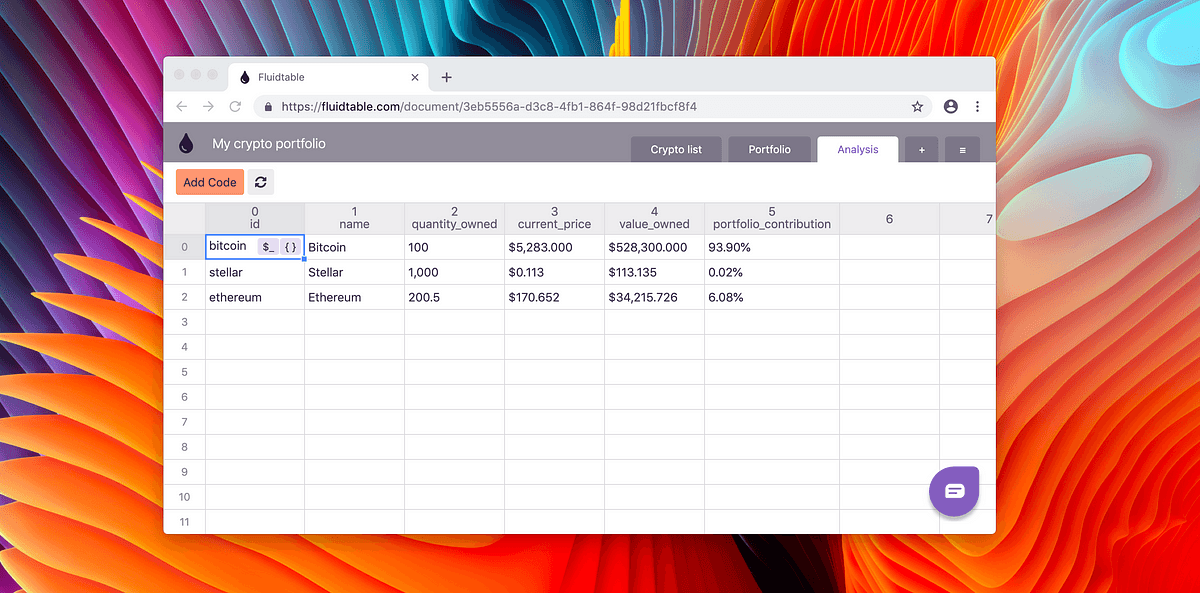
I will show you how to fetch your cryptocurrencies updated prices, calculate how valuable your investments are and how much each cryptocurrency is contributing to diversifying your portfolio. All inside a few spreadsheets.
I tried many times to create complex analysis and models in spreadsheets. But often I was not able to achieve my goal, due to lack of some functions/formulas to solve the problem I faced.
If only I was able to write some JavaScript code inside this cold heartless spreadsheet!
I was so frustrated about this that I quit my engineering job. I looked for a cave and I started crafting a solution to this personal drama. After two months of slaving behind a keyboard, I am proud of presenting you, my dear dear readers, Fluidtable!
With Fluidtable you can write JavaScript code inside the spreadsheet cells.
Now let me show you how simple and satisfying is to create your own cryptocurrencies portfolio with your own custom analyses all inside a few programmable spreadsheets!
Create a new document
After you’ve created an account on Fluidtable, create your first document. Tap the **New document** button, then click on the document created.


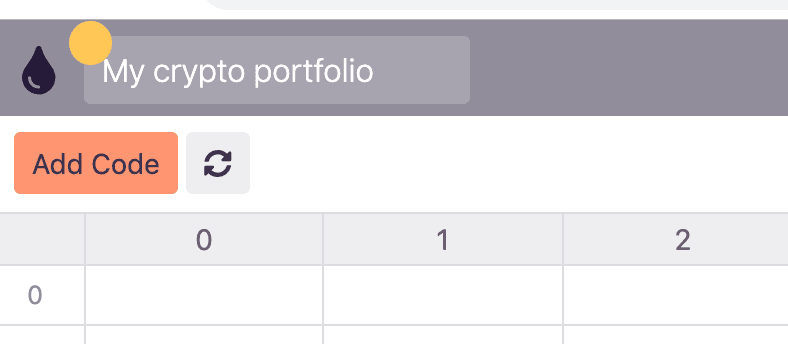
Once you open the document, in the top left, rename the document to **My crypto portfolio**.
Fetch all cryptocurrencies basic information
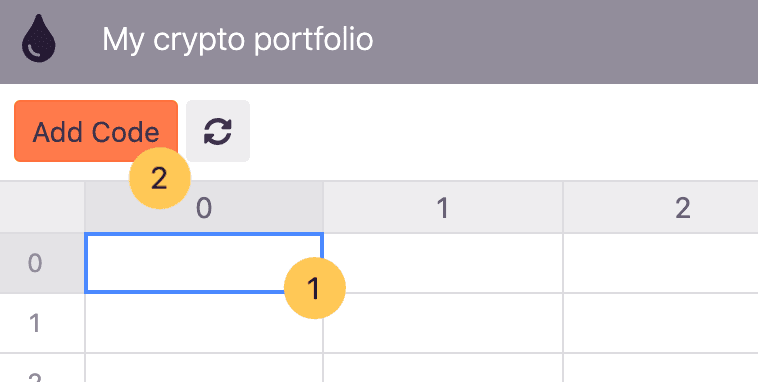
Now you can start to rock’n’roll! Click on the first cell of the document, the one at row 0 and column 0. Then click the **Add code** button.
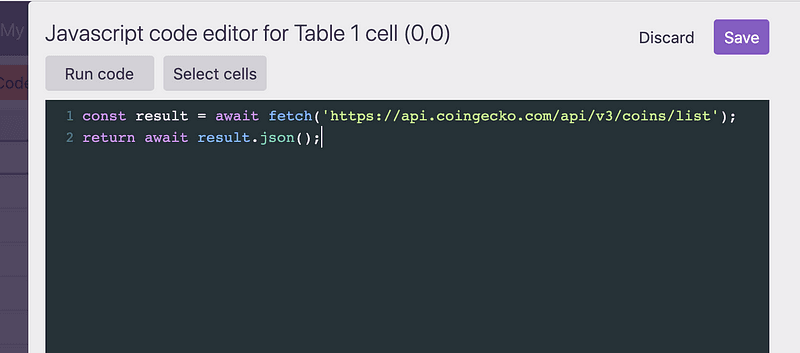
Shazam ⚡️⚡️ I present you the JavaScript code editor!
You are going to get the info of the cryptocurrencies from Coingecko. They provide a great service with a free API! Copy and paste the following lines of code inside the editor. It will get the list of available cryptocurrencies with ID, symbol and name. Then **Save**.
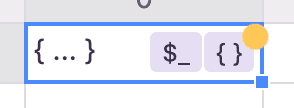
In the cell, there is a weird symbol. It’s the symbol of an object. It means that there is a lot of information packed inside there! Click the **Object view** symbol in the cell (the one who looks like this **{…}**).
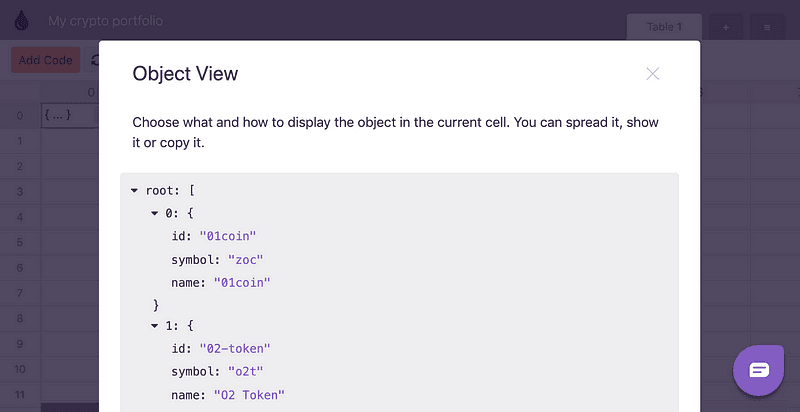
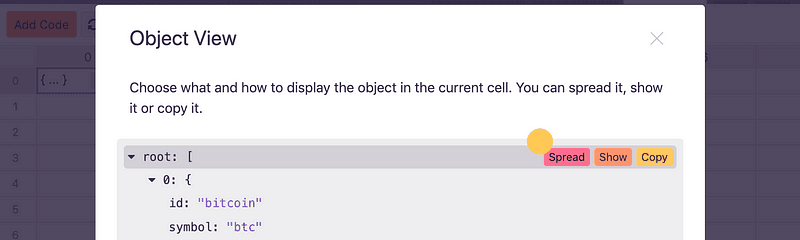
With the Object View, you are able to unpack all that information into a visual form. This is a list of cryptocurrencies 🤓. Each entry has an id, a symbol and a name.

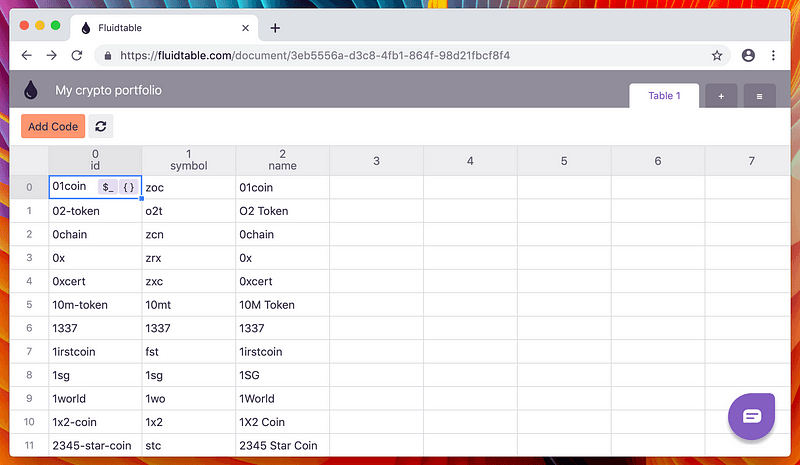
If you hover the cursor over the first ever line named **root**, you will see few buttons appear. Click **Spread** and it will spread the list of value over the table. Each crypto will occupy one row. This is 🧙♀️ magic!
Add your cryptocurrencies possessions 💰
On the top right, you see that there is a tab named Table 1. Next to it, there is a hamburger menu **≡**. Click on it 🍔.

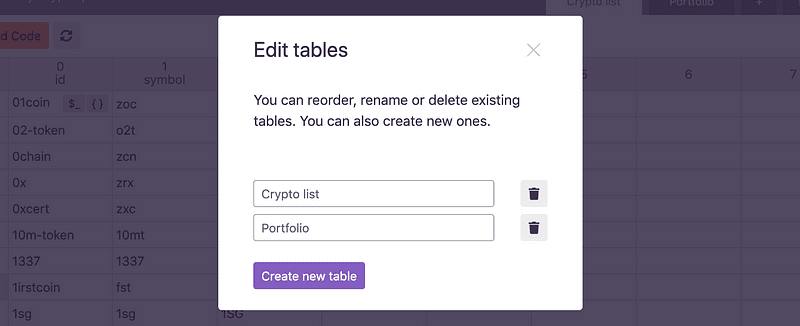
Start by renaming Table 1 to Crypto list. Then create a **New table** and name it Portfolio.
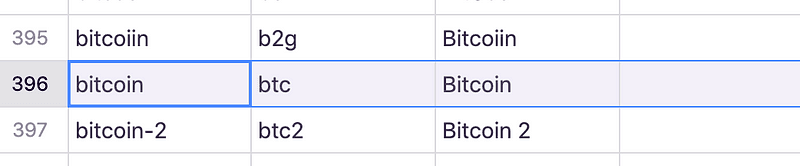
Let’s say you own 100 Bitcoins (you wish 😭), you want to add them to the portfolio. First, you need to find Bitcoin’s ID on Coingecko, so later you can ask for more information about it. Go to `Crypto list` and look for Bitcoin, in the third column.
Spoiler alert: it was close to line 396 at the time of writing.
In the first column, there is the Coingecko ID, that for Bitcoin is bitcoin 😱. It’s important that you copy the ID as is else it will not work later.
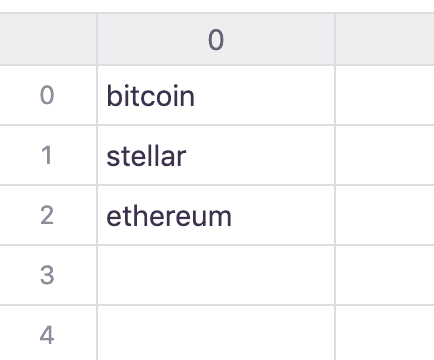
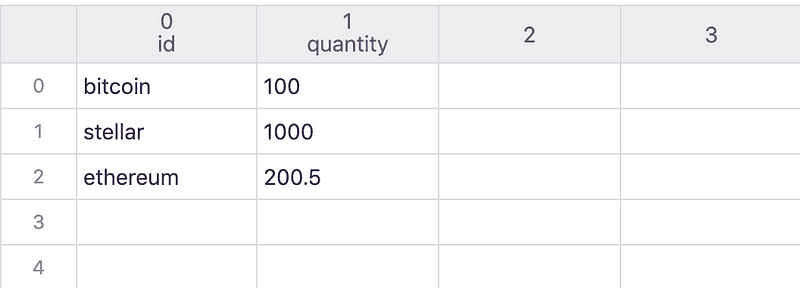
Go to the Portfolio table and add in the first cell bitcoin. Repeat this operation with the other cryptocurrencies you own. Like Stellar and Ethereum (IDs stellar and ethereum).
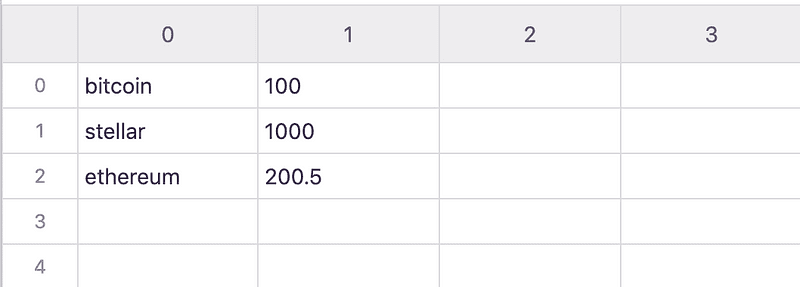
In the second column add how much you own of every cryptocurrency. For example add 100 Bitcoins, 1000 Stellar and 200.5 Ethereum.
Note for the Italians reading 😉: use . and not , to separate the decimals. For example 10.2 is correct, while 10,2 is not.
By the way, I know that the networks are Ethereum and Stellar, while the tokens are Ether and Lumen. But that’s a battle for another day.
To keep things clear, right-click on the column 0's header and click **Rename column**.
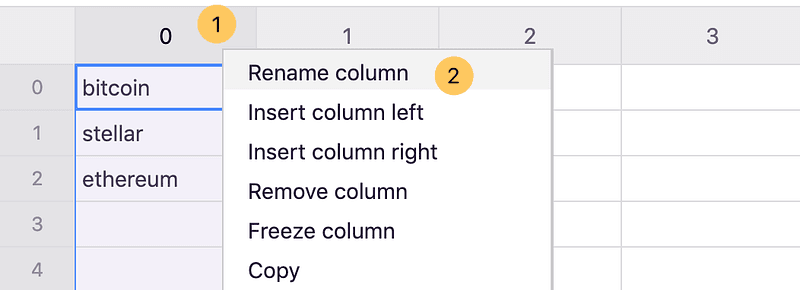
Name the column id. Then rename the column 1 to quantity.
Fetch your cryptocurrencies’ information
Create a new table and name it Analysis.

Select the first cell (0, 0) then click **Add code**.
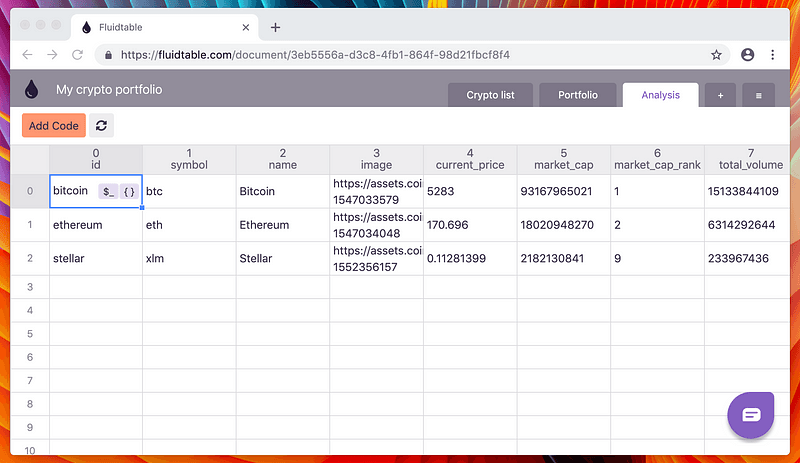
In the code editor, we are writing a few lines to get the information of the cryptos in our portfolio. Copy and paste the following lines. Then **Save**.
Note: If you want more details about what other data Coingecko API can offer you go here.
Click on the **{…}** object view button in the cell saved and then **Spread** the root again. 🤯 amazeballs!
Add your analyses
You want to add two key information:
- the value of each cryptocurrency investment
- the contribution each cryptocurrency is making to the total value of your portfolio.
Open the Code editor in the first cell and edit the code you wrote before. Remove the last line return await response.json();, then append the following code:
In case you need it, here you can find the entire code for this step.
Save then apply the **Spread** from the **Object view** button. Here we have the cryptos again, but with only the values you care about and with your custom analyses.

Make these numbers easier to read
Well done, ladies and gentlemen 🧐. But to be fair it looks a little rough. Let’s fix it.
In the toolbar click on **Data format** button.

From the modal that opens, select the column you want to fomat. For example 3 (current_price).

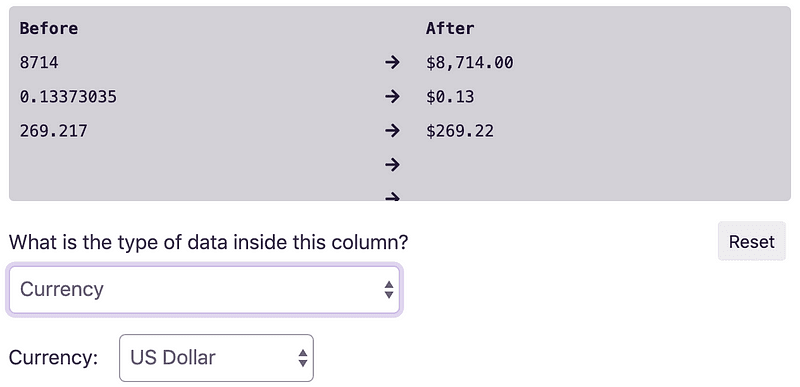
You will have a preview of how the data is right now and how it will look like after you set what the data represents.
Select from the menu the type Currency and it will automatically recognize and format it.
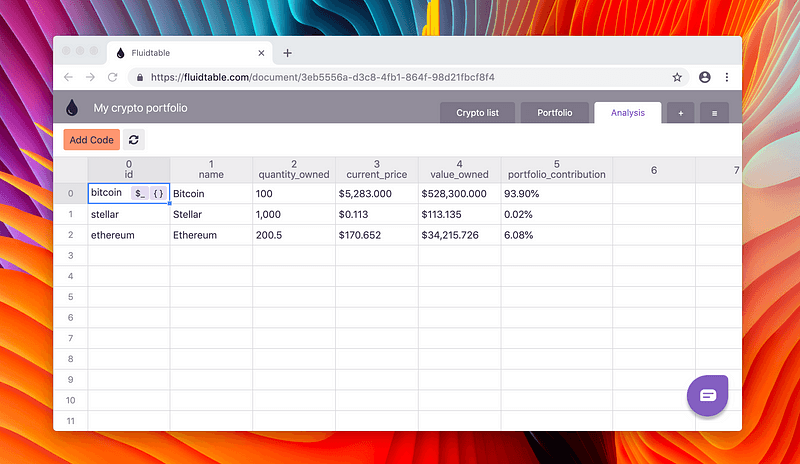
Repeat this operation for quantity_owned (type Number), value_owned (type Currency) and portfolio_contribution (type Percentage). Then click the **Save** button.
Look how beautiful it is! 🤩
Conclusion
I am sure I gave you some inspiration on how to program spreadsheets. You have all the knowledge to customise this analysis and to create new ones.
Write to me suggestions and feedback on how to improve this article and Fluidtable. I know it’s still a little rough around the edge and lacking some features. But I have to start somewhere and I am working hard making it better every day!
Read next
A chat with crypto enthusiast Phillip Liñan
Phillip Liñan on the tip from his father that led him to Bitcoin in 2014, trading forex and crypto full time, and explaining it all to everyone else.
A chat with crypto investor and engineer Lorenzo Decaria
How a software engineer approaches crypto investing: Lorenzo Decaria on trading since 2011, custom TradingView indicators and building a mining rig.
A Conversation with Crypto Trader and Investor James McDowall
First of a series of interviews with crypto investors: James McDowall on going from professional golf to wealth management and then to trading.